
VOO vs. SCHD: Choose the Portfolio Role Before the Returns
VOO and SCHD are often presented as rivals in a contest between growth and income. That framing is convenient—and incomplete. The more useful comparison begins with the exposure you want, not the fund that recently won.
By Jyoung Ahn · October 5, 2026
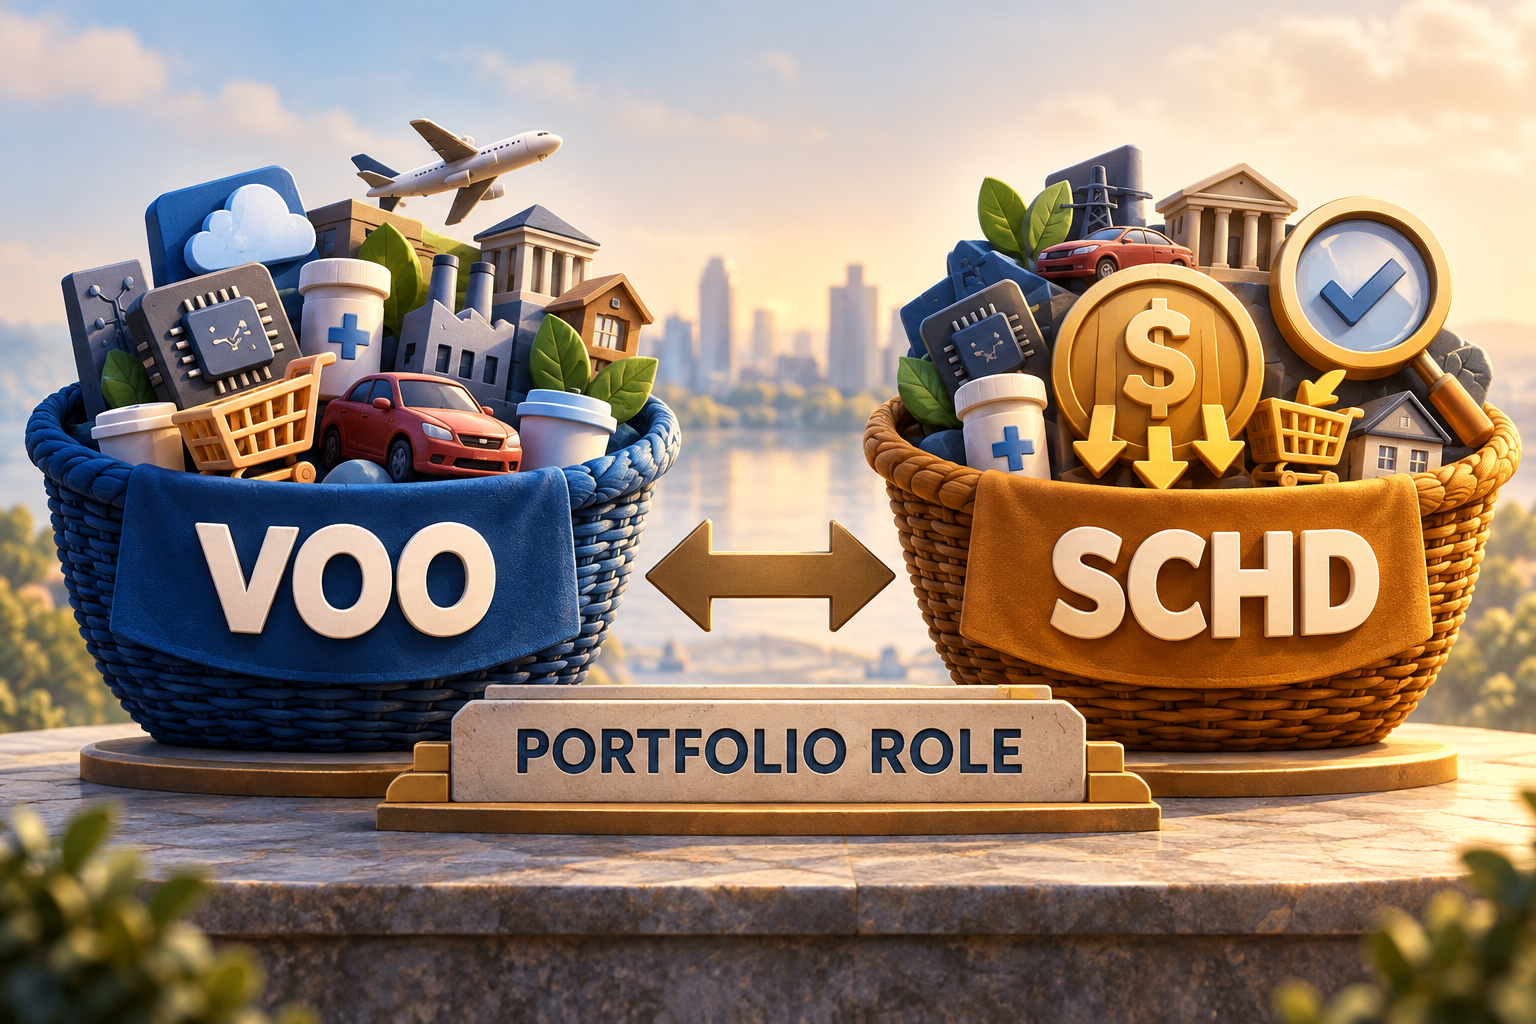
A comparison of two familiar ETFs can become a substitute for an investment plan. One investor points to a return chart. Another points to a dividend yield. Each has selected the scoreboard that flatters the preferred fund. Neither has necessarily explained why the holding belongs in the portfolio.
Vanguard S&P 500 ETF (VOO) and Schwab U.S. Dividend Equity ETF (SCHD) are useful examples because their differences are real, but the popular shorthand exaggerates them. VOO pays dividends; SCHD participates in stock-market gains and losses. Neither fund removes the need to decide how much equity risk to own.
Building on our framework for managing growth and dividend ETFs after purchase, this comparison asks three questions: What rules create the exposure? What does that exposure contribute? What would justify changing its size or replacing it?
1. VOO: large-cap blend, not pure growth
Vanguard’s June 30, 2026 fact sheet identifies VOO as a large-cap equity fund tracking the S&P 500. Its investment-style illustration centers on large-cap blend. That distinction matters: participation in the growth of invested wealth does not make a fund a growth-style strategy.
The S&P 500 represents leading large U.S. companies. Its market-capitalization structure is not an equal-dollar allocation to 500 businesses. Large constituents can exert substantial influence on the result. An investor choosing this approach accepts the market’s distribution of size rather than independently deciding which style or sector deserves the greatest weight.
VOO can therefore serve as a broad U.S. large-cap building block. “Broad” needs a boundary: it is not the entire U.S. stock market, the global stock market, or a balanced stock-and-bond portfolio. Its role can be central without its coverage being universal.
2. SCHD: dividend equity, not safe cash
Schwab’s stated objective for SCHD is to track the total return of the Dow Jones U.S. Dividend 100 Index before fees and expenses. The strategy emphasizes dividend quality and sustainability. That describes a way to select equities, not a contractual payment to the investor.
S&P Dow Jones Indices explains that the index family considers dividend-payment history and financial measures including cash flow relative to debt, return on equity, dividend yield, and five-year dividend growth. A record of paying dividends is not the same as a requirement that every company raise its dividend every year.
The investment implication is a deliberate departure from broad-market exposure. The resulting portfolio can emphasize different businesses and sectors. Quality screens are a selection process; they do not make the holdings recession-proof or eliminate the possibility of capital losses.
SCHD may supply a dividend-oriented equity allocation, whether distributions are spent or reinvested. It does not automatically replace bonds, cash, or a withdrawal plan. The investor still needs to ask whether the underlying equity risk is appropriate for the money’s intended use.
VOO information: June 30, 2026 Vanguard fact sheet. SCHD objective and expense ratio: official page reviewed October 5, 2026. Verify current documents before investing. Portfolio interpretations are editorial analysis.
3. What do the two funds actually own?
Selection rules matter because they change what you own. The same reporting date offers a concrete illustration. The comparison below uses selected sector weights published by the two providers for June 30, 2026. It does not attempt to score one mix as better.
Information technology
VOO
38.0%
SCHD
9.23%
Health care
VOO
8.9%
SCHD
20.72%
Consumer staples
VOO
4.6%
SCHD
20.38%
Selected sector weights as of June 30, 2026. Sources: Vanguard VOO fact sheet and Schwab SCHD sector table. Only three sectors are shown—not a complete allocation. These are holdings weights, not returns, and they can change.
At that date, the reported information-technology weights were 38.0% for VOO and 9.23% for SCHD. SCHD had higher weights in health care and consumer staples in this comparison. These differences give an investor something specific to evaluate. They are not evidence that either portfolio will outperform next year.
An investor with substantial technology exposure through other holdings might view a dividend tilt differently from an investor whose existing portfolio already emphasizes similar dividend-paying sectors. The same ETF can reduce one concentration while reinforcing another. Its usefulness depends on the holdings around it.
Owning both also does not create two independent asset classes. Both remain equity strategies, and both may hold some of the same companies. Different sector weights can alter portfolio behavior without providing the protection implied by a stock-versus-bond comparison.
4. Compare performance with the same ruler
A price-only comparison systematically misses distributions. A yield-only comparison misses changes in investment value. Start with total returns over identical dates, with the same treatment of reinvestment, fees, and taxes. If one number is a market-price return and the other is a net-asset-value return, acknowledge the difference rather than silently treating them as interchangeable.
Then distinguish evaluation from prediction. Historical returns can show how these strategies behaved in a particular environment. They cannot establish which strategy will lead over the investor’s next holding period. Changing the start date can change the apparent winner without changing either fund’s selection rules.
Two benchmarks are useful for two different questions. The fund’s own benchmark helps assess implementation. A broad-market benchmark helps reveal the opportunity cost and behavior of choosing a tilt. A dividend strategy can execute its benchmark well and still lag the S&P 500. That is not automatically a management failure—but it is still a result the investor must be willing to own.
This article intentionally avoids a simulated wealth race built from a recent return rate. Compounding a historical rate into the future would make the arithmetic look precise while leaving the investment assumption unsupported. The decision here is about exposure and purpose, not a forecast disguised as a chart.
5. Put the fee difference in perspective
The cited expense ratios are 0.03% for VOO and 0.06% for SCHD. At a hypothetical constant $100,000 balance, those rates imply approximately $30 and $60 in annual fund expenses. Fund expenses are reflected in the investment’s results rather than arriving as a separate invoice.
VOO · expense ratio 0.03%
$30
Illustrative annual fund expense at a constant $100,000 balance.
SCHD · expense ratio 0.06%
$60
Illustrative annual fund expense at a constant $100,000 balance.
$100,000 × 0.0003 = $30; $100,000 × 0.0006 = $60. Not separate invoices or actual expenses for a fluctuating account. Excludes trading spreads, taxes, and other costs.
Costs deserve attention, but a $30 illustrative difference does not settle whether an investor should hold broad large-cap exposure or a dividend-oriented tilt. The holdings, selection rules, and chosen allocation can have a much larger effect on the portfolio’s behavior. Cheap implementation is valuable only after the investor has decided what to implement.
A switch also has costs beyond the expense ratio. A taxable sale may realize a gain; a purchase or sale crosses a trading spread. The SEC’s ETF bulletin explains why an ETF’s trading price, net asset value, fees, and trading costs deserve separate attention.
6. Owning both still requires a reason
One defensible architecture is to treat broad large-cap exposure as a foundation and a dividend-oriented position as a deliberate tilt. Another is to use dividend equity as an important component of a cash-flow plan. Neither architecture establishes a universal percentage, and neither makes a two-fund portfolio complete.
Before choosing a split, describe what increasing SCHD would change: the selection discipline, sector weights, distribution pattern, and relationship to existing holdings. Describe what decreasing VOO would give up: participation at the broad index’s weights. If the explanation is merely that both funds are popular, the allocation still lacks an investment argument.
For additional purchases, examine the current portfolio first. Directing new money to the smaller holding may help maintain an intended mix; blindly buying the recent winner may unintentionally change it. Reinvesting dividends into the same fund is one possible policy, not the only one.
For replacement or sale, separate a changed objective from a disappointing result. A need for near-term spending can justify revisiting equity exposure generally. It does not automatically imply that moving from VOO to SCHD solves the problem. Likewise, SCHD’s lagging a growth-led market does not, by itself, invalidate a consciously chosen dividend tilt.
The bottom line: choose the role, not the trophy
Ask instead: “Which exposure am I trying to own, what does it change in my portfolio, and what evidence would make me reconsider?” VOO offers one set of rules for participating in U.S. large-cap equities. SCHD offers another set of rules emphasizing dividend-paying businesses. Their differences are meaningful without being reduced to growth on one side and safety on the other.
The strongest comparison ends with a clearer portfolio mandate, not a trophy. If an investor cannot explain why a holding belongs, a longer performance chart will not supply the missing purpose.
Sources, data dates, and disclosure
- Vanguard: VOO fact sheet, June 30, 2026—fund approach, style illustration, expense ratio, and sector weights.
- Schwab Asset Management: SCHD—objective, expense ratio, and June 30, 2026 sector weights; reviewed October 5, 2026.
- S&P Dow Jones Indices: S&P 500.
- S&P Dow Jones Indices: Dividend Strategy with Quality Yields.
- SEC Investor.gov: Updated Investor Bulletin—ETFs.
Data comparisons and cost calculations above are original InvestingAIDesk presentations. Current holdings and expenses may differ from the dated information above.
Educational information, not personalized investment or tax advice. Both funds can lose value. Distributions are not guaranteed; past performance does not predict future returns. The author does not hold VOO or SCHD and receives no compensation from the discussed fund providers.


One Comment