
5 ETF Investing Myths That Can Cost You Money
By Jyoung Ahn
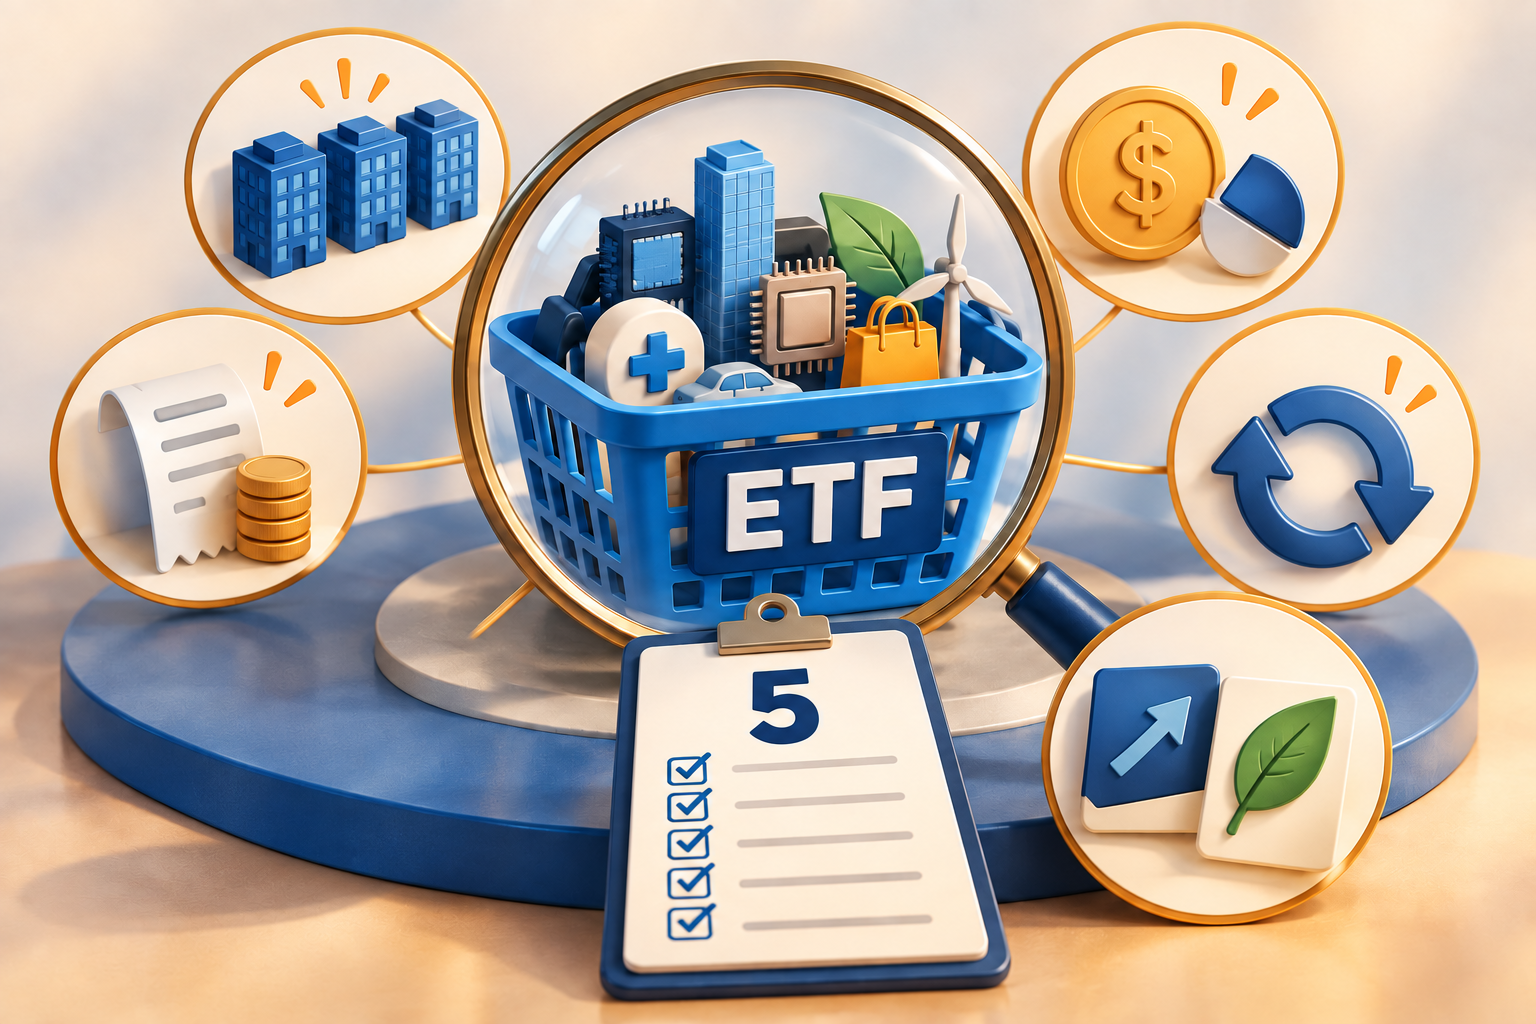
ETFs make investing easier—not foolproof. More funds do not necessarily mean better diversification, higher distributions do not guarantee better returns, and holding longer does not make every strategy suitable. Whether you are considering your first ETF or reviewing a portfolio built over a decade, these five misconceptions deserve a closer look.
The most expensive ETF mistake may begin with a belief that sounds sensible: “I own several funds, so I am diversified.” “The payout is higher, so the investment is better.” “I plan to hold for years, so the short-term mechanics do not matter.” Each statement takes a potential advantage and turns it into an assurance the product cannot provide.
These assumptions can accompany a first purchase, survive a year or two of ownership, or become embedded in a portfolio held for a decade. Experience is valuable, but the passage of time is not a test of whether the original reasoning was sound. A profitable holding does not, by itself, validate every belief behind the purchase.
This is not an argument against ETFs. It is an argument against confusing a convenient investment structure with a complete investment plan. For U.S. investors choosing U.S.-listed funds, the questions remain specific: what does the fund own, how does its strategy work, what role does it serve, and what are the consequences of changing the position?
The five myths below can cost money through unintended concentration, misunderstood cash flows, avoidable friction, or unsuitable risk—not because every investor who believes them will inevitably lose money. The purpose is to replace reassuring shortcuts with better judgment.
Myth 1: “Growth and dividend ETFs can be managed the same way.”
The attraction is a simple rule: buy a good ETF, add when the price falls, and replace it when something else performs better. But a rule that ignores the purpose of the holding can turn disciplined-looking activity into an incoherent portfolio.
Why the belief breaks down
“Growth” and “dividend” are useful starting labels, but neither is a complete investment mandate. A growth-oriented equity ETF, a dividend-quality strategy, and an option-income fund may all own stocks. That does not mean they should be evaluated with the same expectations—or managed in response to the same signals.
Consider two investors watching an equity ETF fall in price. One is accumulating capital for a goal decades away; the other depends on portfolio withdrawals now. The same market move raises different questions about liquidity, allocation, and the consequences of selling. It does not mechanically prescribe different trades, but it changes what must be examined before a trade is made.
A growth allocation might be evaluated primarily through long-term total return, concentration, and whether its exposure still fits the portfolio. A dividend-oriented allocation requires attention to the same capital risk, while adding questions about the consistency and source of distributions. Someone spending those distributions has a different cash-flow problem from someone automatically reinvesting them.
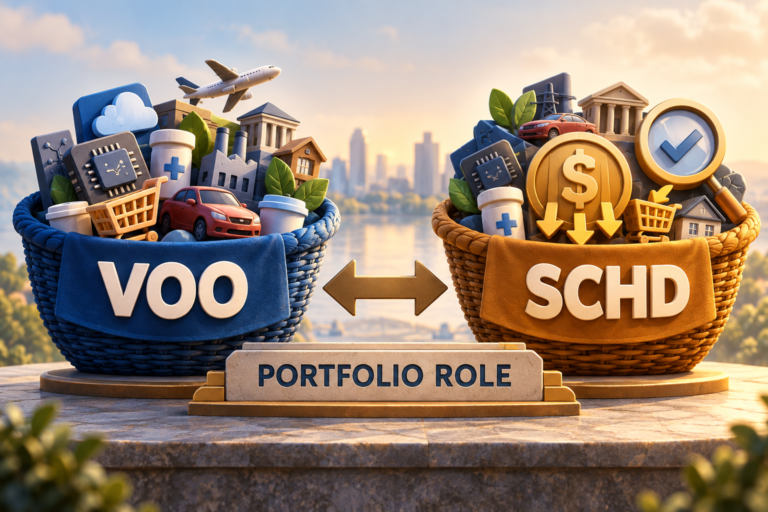
Even within the dividend category, the distinctions matter. SCHD, for example, tracks an index emphasizing dividend quality and sustainability. That is not the same design as a fund using call options to generate cash distributions. The label “income” does not erase the difference. Schwab: SCHD objective and strategy
A better way to evaluate the holding
Editorial framework, not a product ranking or an automatic buy/sell rule. These roles can overlap, and all three can lose money.
Before adding to a holding, write down the reason for owning it and the condition that would make that reason no longer valid. Additional purchases should be evaluated against the target allocation and the continued suitability of the strategy—not merely against the purchase price. A holding is not automatically a bargain because it is below an investor's cost basis.
For a growth allocation, a decline raises questions about exposure, concentration, and the time available to withstand losses. For a dividend-oriented allocation, it also raises questions about the source and reliability of the cash flow and whether spending needs remain covered. Neither role eliminates the need to evaluate total return. The difference is the management problem, not a blanket instruction to buy one and sell the other.
Replacement deserves an equally specific explanation. Has the fund's strategy changed? Has the investor's need for income or liquidity changed? Is the position duplicating another exposure? Or is the investor simply responding to recent underperformance? These are different problems. They should not share a reflexive solution.
Myth 2: “The more ETFs I own, the better diversified I am.”
A longer holdings list can feel like a safer portfolio. The number of ticker symbols, however, is an inventory count—not a measure of how independently the underlying investments behave.
Why the belief breaks down
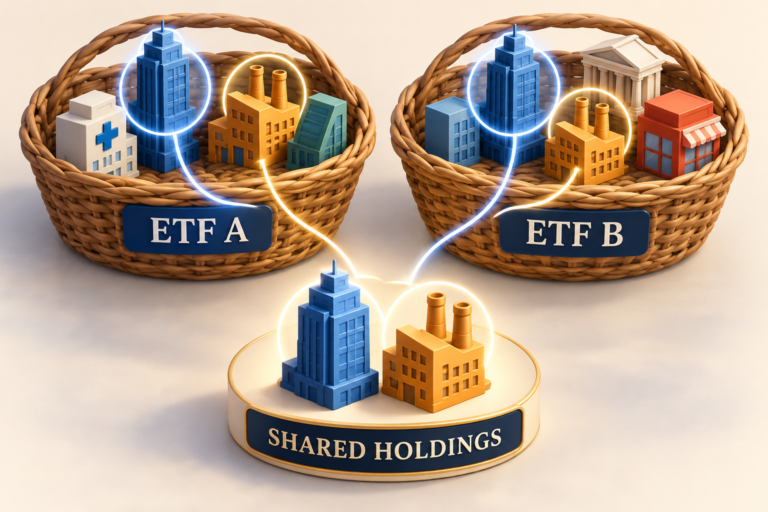
Four equity ETFs can represent four strategies—or several versions of the same bet. Fund names, sponsors, and share prices reveal little about the portfolio's combined dependence on a company, sector, or investment style.
An investor who owns a broad U.S. equity fund, a large-cap growth fund, and a technology-focused fund may deliberately want a growth tilt. That is a legitimate portfolio choice. The error is describing the additional holdings as diversification without examining what they add.
The relevant calculation is straightforward: multiply each fund's portfolio weight by its weight in a particular company, then add those exposures across funds. In the hypothetical example below, three differently named funds produce a 10.5% allocation to a single company.
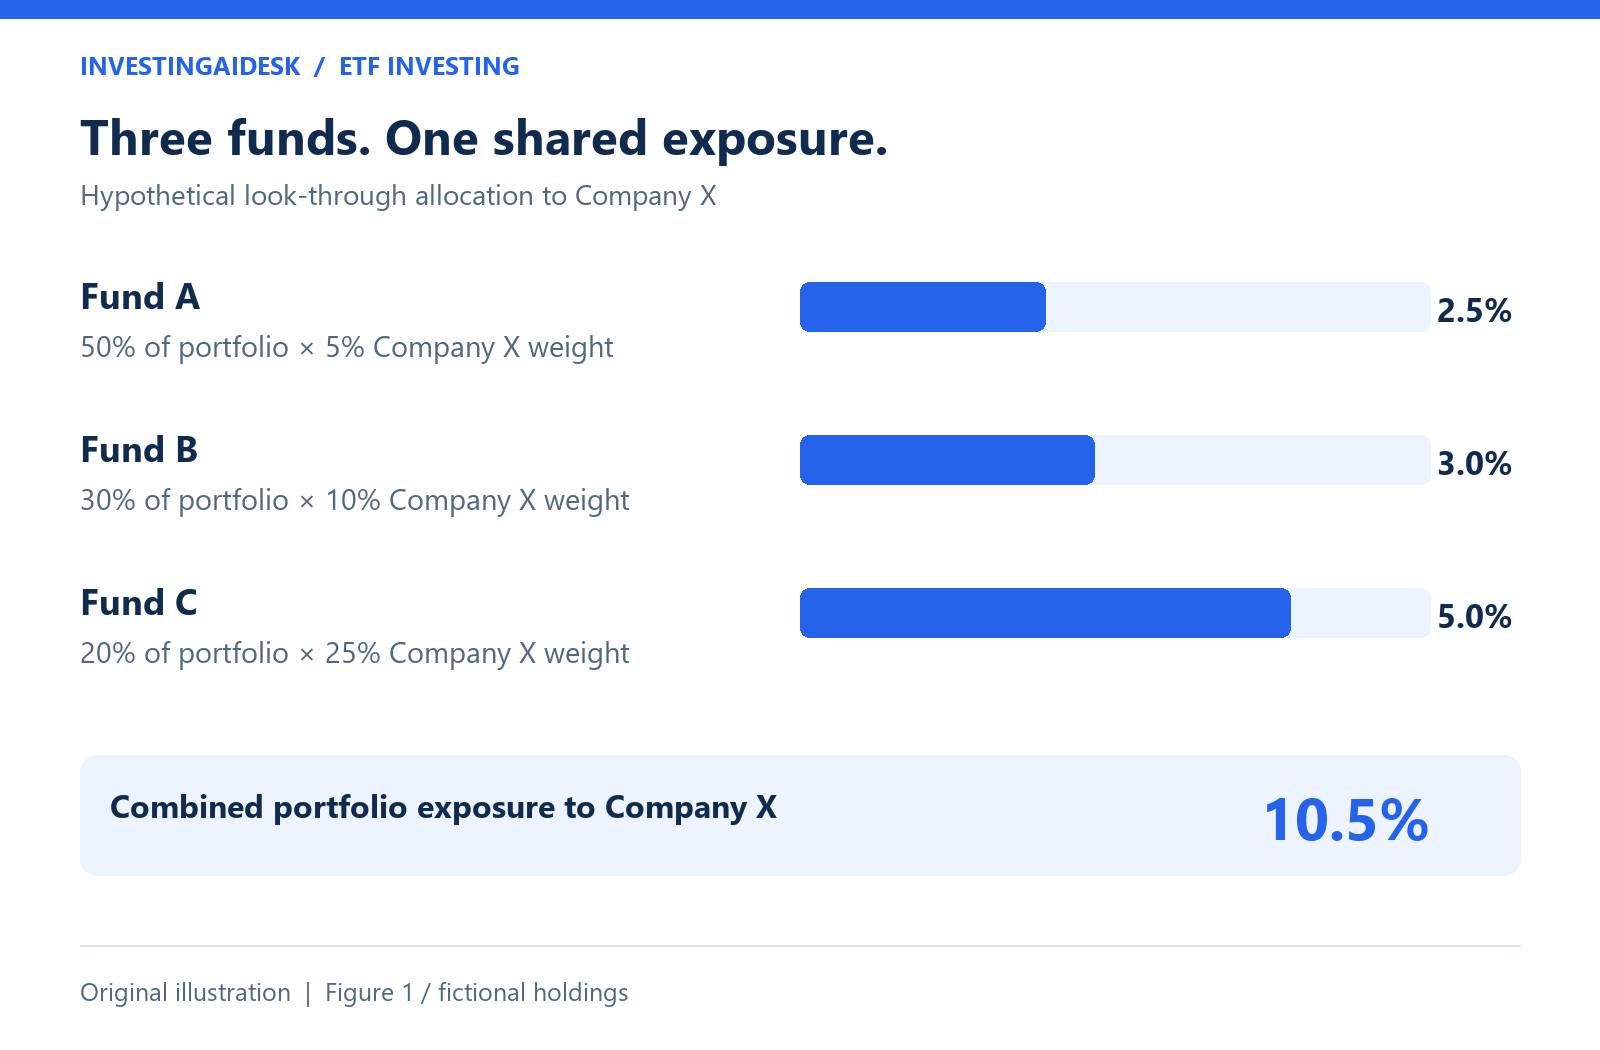
Figure 1. Original illustration. Fund A, B, C, and Company X are fictional. Calculation: 50% × 5% + 30% × 10% + 20% × 25% = 10.5%. These are not current holdings of any named ETF.
That calculation is a starting point, not a complete risk model. Companies can share economic sensitivities without being identical holdings. Funds with limited company overlap can still be exposed to the same interest-rate, valuation, or business-cycle pressures. Historical correlations can change when market conditions change.
The SEC cautions that narrowly focused funds do not necessarily provide sufficient diversification; looking through to the underlying investments matters. Investor.gov: Asset allocation and diversification
A better way to evaluate diversification
There is no universal overlap percentage that separates a good portfolio from a bad one. An intentional overweight and an accidental concentration may look identical on a holdings report; the distinction lies in the investor's objective, risk capacity, and awareness.
Before adding another fund, examine combined company and sector weights, investment styles, and the role of each asset class. Reducing the number of funds is not automatically an improvement either: one narrowly focused ETF can be more concentrated than a thoughtfully constructed group. The objective is a deliberate allocation, not the shortest or longest possible list.
Myth 3: “A higher distribution means a better investment.”
A monthly payment looks tangible in a way that an unrealized gain does not. That can make a high-distribution fund appear productive even when the investment's remaining value deserves closer scrutiny.
Why the belief breaks down
A cash payment is easy to see. The economic trade-offs behind it are less visible. That asymmetry makes distribution rates persuasive marketing figures—and incomplete measures of performance.
For an investor taking cash rather than reinvesting, the simplest one-period check is the change in investment value plus cash received, measured against the starting investment. It is not a substitute for a fund's standardized total-return series, but it helps prevent a familiar error: counting the distribution while overlooking the remaining capital.
Suppose two fictional investments each begin at $100. One ends at $104 and pays $2 in cash. The other ends at $94 and pays $8. Before taxes and other costs, their combined ending value is $106 and $102, respectively. The larger payment does not establish the better economic result.
Investment A · starts at $100
$106
$104 remaining shares + $2 cash. Hypothetical combined ending value.
Investment B · starts at $100
$102
$94 remaining shares + $8 cash. The larger payout does not establish the better result.
Figure 2. Original one-year illustration, not fund performance. Payments are held as cash, not reinvested; there are no additional deposits, withdrawals, taxes, or costs. Actual fund total-return calculations generally assume reinvestment and will differ.
An option-income strategy can exchange some upside participation for premiums, with the precise trade-off depending on its implementation. That does not make every such strategy inferior, nor does it make its payment a substitute for examining risk. Global X explicitly states that QYLD's quoted distribution rate is not the fund's total return. Global X: QYLD distribution disclosures
Return of capital also requires care. The tax classification alone does not prove that a strategy is economically destroying wealth. Conversely, a favorable tax label does not prove that a payout is sustainable. The questions are separate: how a distribution is classified, and whether the investment's overall performance and remaining capital support its intended role. NEOS: Return-of-capital explanations
For U.S. taxable-account holders, the IRS explains that nondividend distributions generally reduce cost basis; distributions beyond a zero basis are generally reported as capital gains. They are not simply additional earned income. IRS Publication 550: Nondividend distributions
A better way to evaluate income
An income-oriented investor needs a review that includes cash received, total return, changes in capital, and tax reporting. A lower payment can warrant investigation; it is not automatically a reason to sell. A higher payment can also warrant investigation; it is not automatically a reason to add.
An investor who spends distributions may reasonably value predictable cash flow. An investor accumulating assets may have different priorities. Neither objective justifies treating distributions as money independent of the investment that produces them. Income utility and investment performance are related, but they are not interchangeable.
Myth 4: “Commission-free trading makes switching ETFs cost-free.”
The absence of a commission removes a visible charge. It does not remove the need to compare the economic consequences of selling one holding and buying another.
Why the belief breaks down
ETF investors can be highly attentive to annual expense ratios while remaining surprisingly casual about the costs of changing holdings. A lower-fee replacement may look compelling until the spread, realized tax consequences, and actual change in exposure are considered.
Commission-free trading is not cost-free trading. ETF shares trade at bid and ask prices, and their market prices can differ from net asset value. These are separate from the fund's annual operating expenses. SEC: Exchange-traded fund investor bulletin
Nor does a taxable brokerage account operate like an IRA. In a taxable account, selling an appreciated position can realize a capital gain. For U.S. federal tax purposes, holding period generally determines whether a gain is short-term or long-term. Avoiding tax indefinitely is not the goal; incorporating it into the decision is. IRS: Topic 409, Capital gains and losses
The account itself belongs in the analysis. Traditional IRA distributions are generally taxable, subject to exceptions such as previously taxed amounts, while qualified Roth IRA distributions are tax-free under applicable requirements. The phrase “tax-advantaged” does not mean that access, eligibility, or withdrawal rules can be ignored. IRS Publication 590-B: IRA distributions
The compounding illustration below isolates a narrower point: a persistent reduction in net return can have a meaningful cumulative effect. It does not estimate the actual tax drag of an ETF or the performance penalty of an investor's trading.
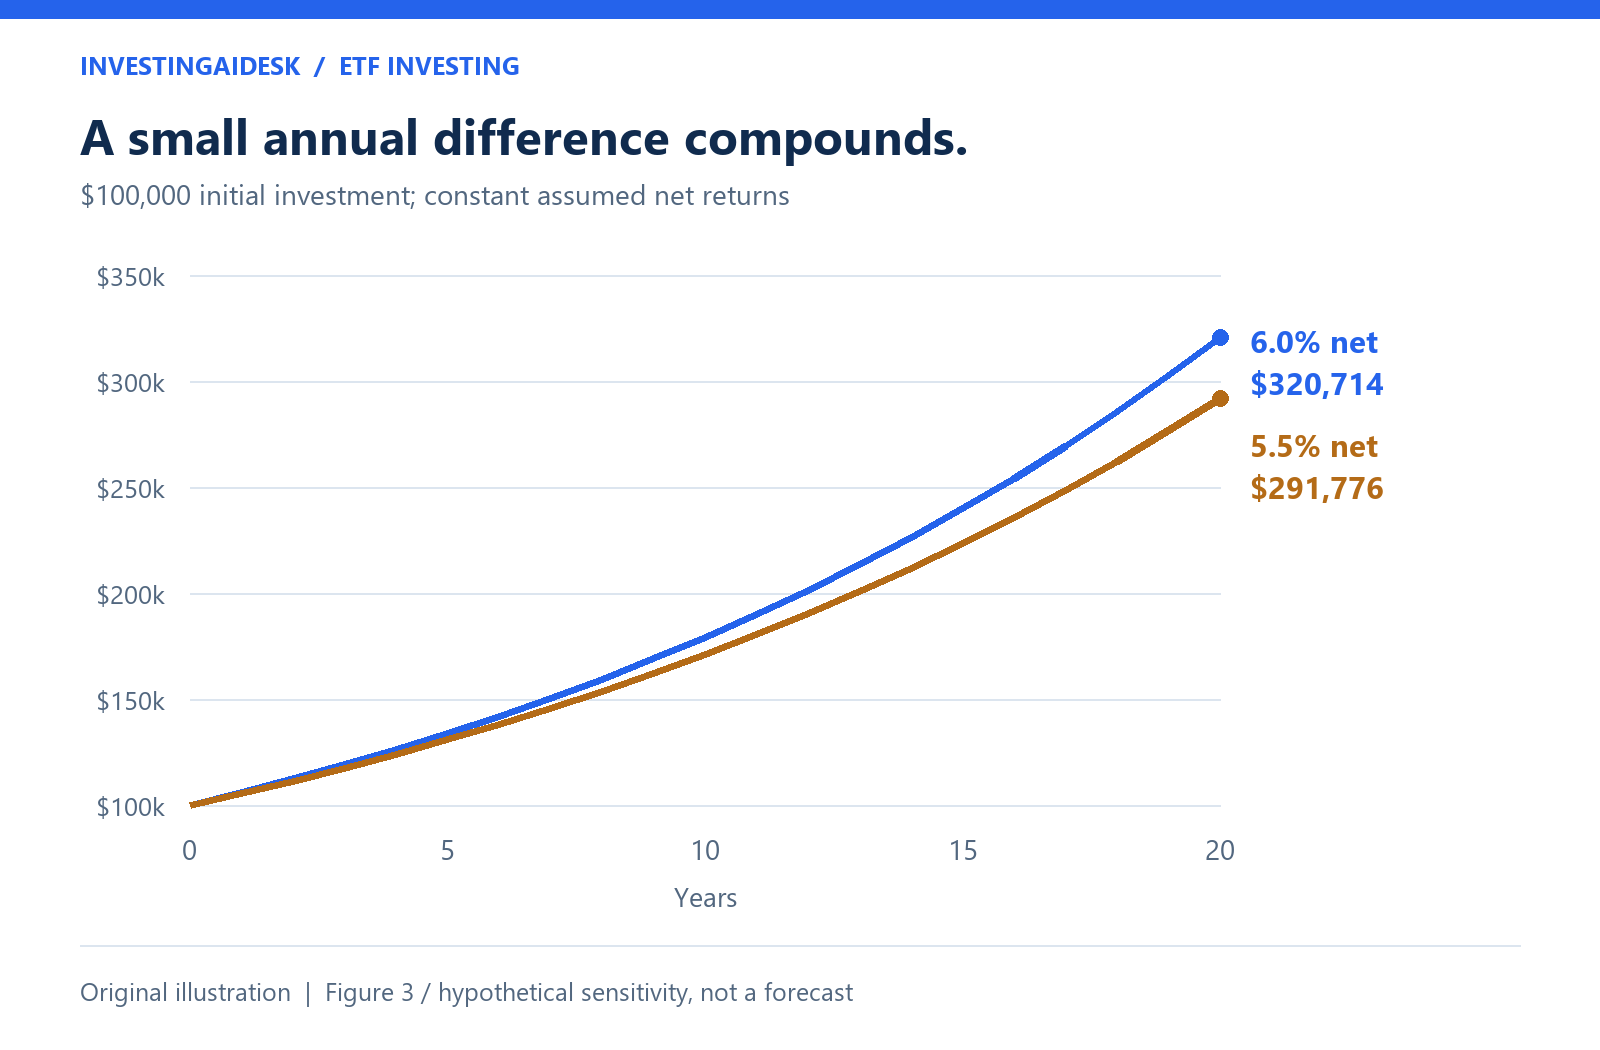
Figure 3. Original sensitivity calculation: $100,000 × (1 + net annual return)^20. No contributions or withdrawals; constant nominal returns; no inflation adjustment. The 0.5-percentage-point difference is an assumption, not an observed behavior gap, fund fee, or tax estimate. Neither return is a forecast.
The SEC's fee guidance likewise emphasizes the cumulative effect of ongoing charges. But a cheaper fund is not automatically the better replacement if it changes the intended exposure. Costs must be compared alongside the investment being purchased. Investor.gov: Understanding fees
A better way to evaluate a switch
Before selling to rebalance, examine whether new contributions or cash distributions could move the portfolio toward its target without the same sale. FINRA identifies directing new money toward underweighted holdings as one possible rebalancing approach and cautions about taxable gains from sales. FINRA: Asset allocation, diversification, and rebalancing
Sometimes a sale remains the right decision. A material risk mismatch should not be preserved indefinitely to avoid a tax bill. The error is making the change first and discovering its full cost afterward.
Myth 5: “A long holding period makes daily leveraged ETFs safe.”
“I can tolerate volatility because I am investing for the long term” is not the same claim as “this product is designed for my holding period.” Patience does not change the reset mechanism of a daily leveraged ETF.
Why the belief breaks down
A daily leveraged ETF introduces a different problem from an unleveraged equity allocation. Its target is tied to a daily return. Extending that target over months or years by simple multiplication misunderstands the product.
Most leveraged and inverse ETFs reset daily. The SEC warns that longer-period returns can differ substantially from the stated daily multiple, particularly in volatile markets. SEC: Leveraged and inverse ETF investor bulletin
Here is an exact two-day illustration. A benchmark rises 10%, then falls by exactly 1/11 (approximately 9.09%)—the amount needed to return precisely to its starting value. An idealized fund delivering twice each daily move would finish at approximately $98.18 for every $100 initially invested; three times each move would finish at approximately $94.55.
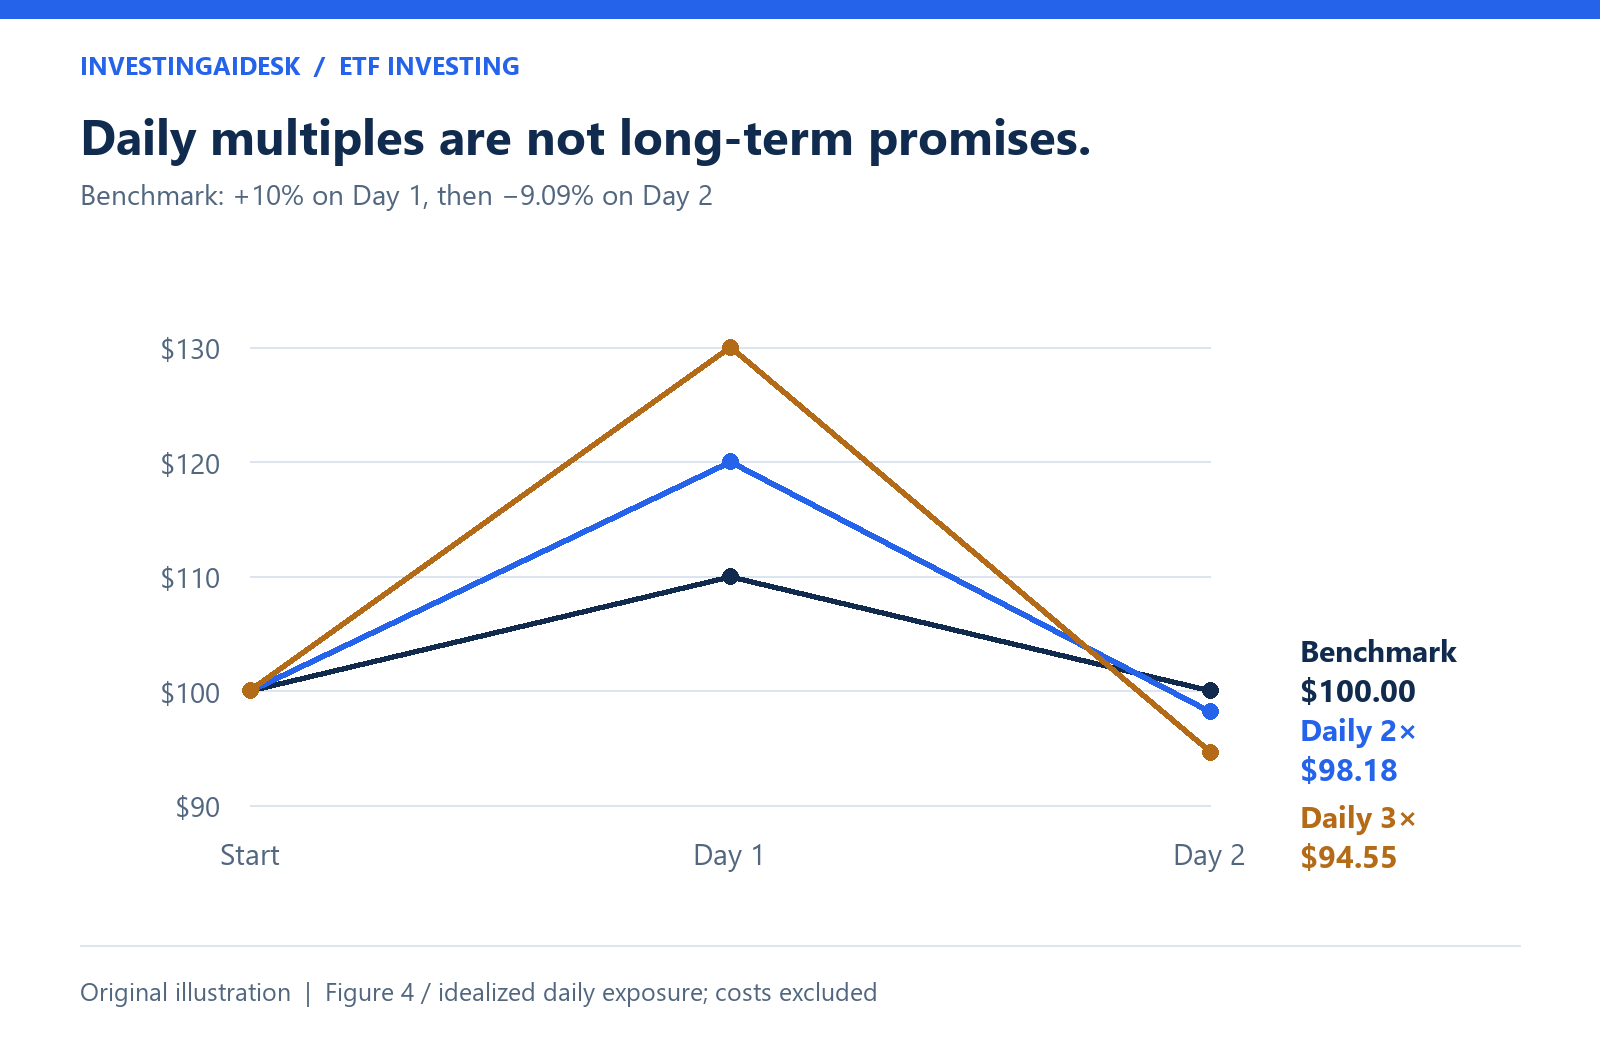
Figure 4. Original mathematical example. Day 1 benchmark return: +10%; Day 2: −1/11, approximately −9.09%. Daily multiples are achieved exactly; fees, financing, tracking differences, and taxes are excluded. This is not actual ETF performance.
The result is path dependence, not proof that leveraged ETFs always lose money. A persistent favorable trend can produce very different outcomes. The essential point is that the sequence of returns matters, so a daily multiple is not a long-horizon promise.
A better way to evaluate leveraged exposure
An investor considering such a position needs more than a bullish market opinion: the product's reset period, risk limits, monitoring requirements, and loss capacity must fit the plan. A long-term growth objective does not, by itself, establish that daily leverage is an appropriate way to pursue it.
There is an important distinction between accepting volatility in an ordinary equity allocation and adding a structure whose exposure changes through daily resetting. Both involve risk; they do not involve the same management problem. Nor should this example be read as a guarantee that an unleveraged ETF becomes safe simply because it is held longer.
Replace reassuring assumptions with a repeatable review
These five myths share a common flaw: they turn a conditional benefit into a general promise. A fund may be convenient without fitting every purpose. Multiple holdings may broaden exposure without diversifying the portfolio. Distributions may meet a spending need without establishing superior returns. An inexpensive trade may still have consequences. A long investment horizon may support a strategy without making every product suitable.
The alternative is not suspicion of every ETF or permanent inaction. It is a repeatable sequence that separates a sound investment decision from an appealing story.
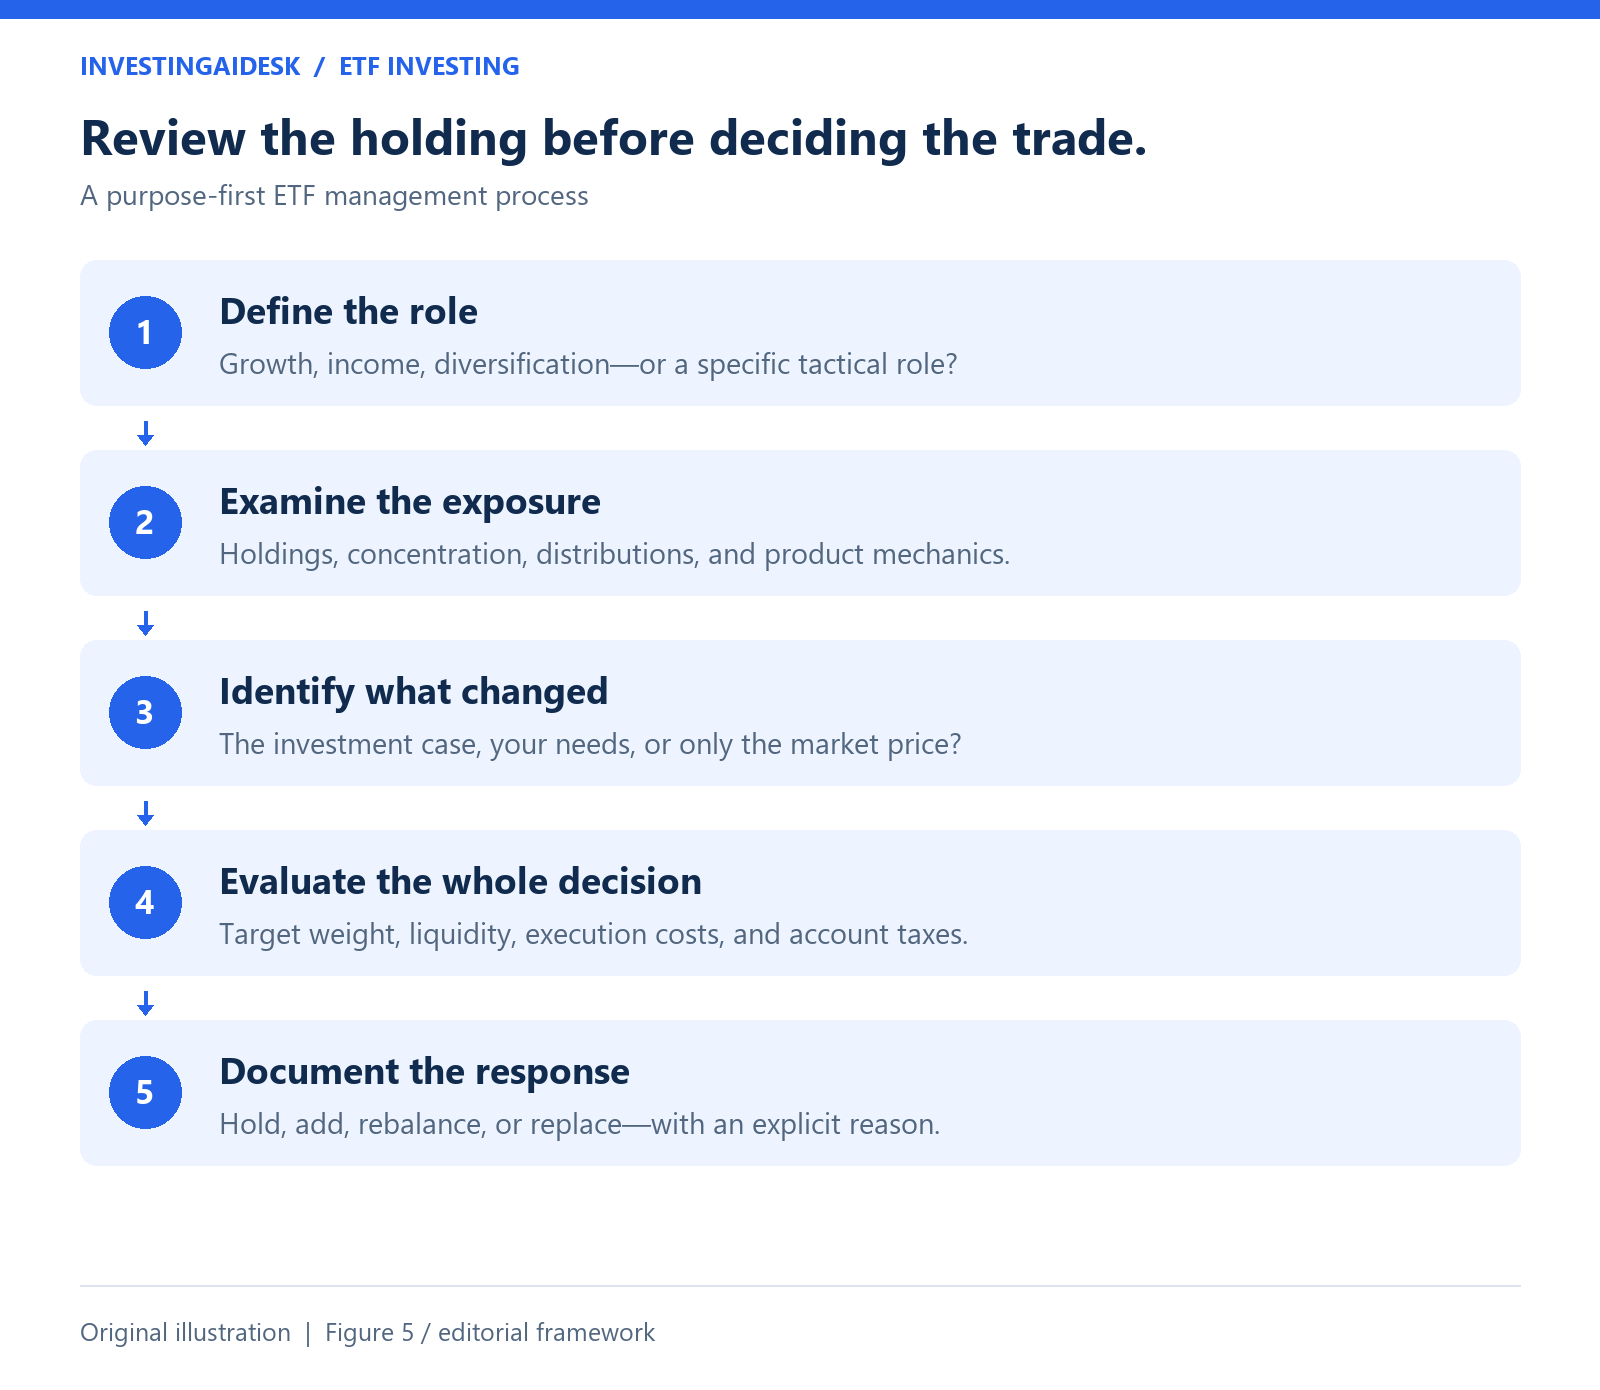
Figure 5. Original editorial decision framework. It does not set universal thresholds or prescribe trades.
For each holding, maintain a brief investment note: its intended role, the measures that matter, the reason for its current size, and the conditions that would trigger a review. Revisit that note when considering an additional purchase or a replacement. The exercise forces a useful distinction between “the price changed” and “the reason for owning it changed.”
An ETF's real contribution cannot be judged by its name, its most recent return, or the size of its next distribution. It must be judged in the context of the job it was hired to do—and the consequences of keeping, enlarging, or ending that assignment.
You do not need to abandon ETFs to abandon these myths. You need to stop asking the wrapper to do work that belongs to the investor: define the objective, understand the exposure, and evaluate the trade-offs. That discipline matters before the first purchase—and remains relevant after the thousandth.
Research and illustration note: Official sources were reviewed on October 5, 2026. All graphics are original InvestingAIDesk illustrations. Numerical examples are explicitly hypothetical and reproducible; none is a historical backtest, a fund comparison, or a forecast. The growth/dividend review framework is editorial analysis, not an official classification or suitability standard. Tickers appear for explanation, not as recommendations. No third-party chart, photograph, or logo has been reproduced.
Disclosure: This article is for general educational purposes and is not personalized investment, legal, or tax advice. ETFs can lose value. Account eligibility, taxes, liquidity needs, and risk tolerance differ among investors; consult the relevant official guidance and qualified professionals when needed.
Author disclosure: As of publication, the author does not hold SCHD or QYLD and has no compensation or affiliate relationship with the fund providers discussed in this article.

2 Comments